Step 2: Build and Review QC Inventory
This notebook creates the QC tables used to decide which records can move into metric calculations. Observed and synthetic records are tracked separately, and a comparison is only eligible when both sides pass for the requested metric, component, and period band.
Imports
These helpers build QC rows, create comparison-ready records, export a manual-review queue, launch the QC dashboard, and make QC overview figures.
[1]:
from spatial_vtk.config.notebook import notebook_timer, register_svtk_cell_timer

with notebook_timer():
    from spatial_vtk.config import SpatialVTKConfig
    from spatial_vtk.config.metrics import metrics_settings_from_config
    from spatial_vtk.config.outputs import resolve_output_path
    from spatial_vtk.io import load_output_table, waveform_preprocessing_label, write_output_table
    from spatial_vtk.qc import (
        build_comparison_eligibility,
        build_event_station_pair_retention_table,
        build_retention_figure_table,
        build_metric_qc_summary,
        build_post_qc_record_table,
        build_qc_waveform_comparison_records,
        build_waveform_qc_summary,
        export_manual_review_queue,
    )
    from spatial_vtk.visualize.dashboard import launch_qc_dashboard
    from spatial_vtk.visualize.waveforms import plot_event_trace_comparison
    from spatial_vtk.visualize.qc import (
        plot_event_station_retention_heatmap,
        plot_post_qc_station_event_map,
        plot_qc_drop_cause_diagnostics,
        plot_retention_summary,
    )
    register_svtk_cell_timer()
Run time: 564.8 ms
Configuration
Load the tutorial config and set the output folder for this QC step.
[2]:
from pathlib import Path

# Use the repository root so paths match the public source checkout.
repo_root = Path.cwd()
config_path = repo_root / "data/examples/configuration/example_spatial_vtk_config.yaml"

# Load the tutorial run scenario and make it the active config for later package calls.
cfg = SpatialVTKConfig.from_file(config_path, run_scenario="tutorial").activate()

notebook_overrides = {"qc_dashboard_port": 8502}
Run time: 21.2 ms
Load the Step 1 Files
Start from the prepared station, event, and event-station tables written by the first notebook.
[3]:
# Read the prepared station table written by Step 1.
stations = load_output_table("prepared_stations")

# Read the prepared event table written by Step 1.
events = load_output_table("prepared_events")

# Read the event-station record table written by Step 1.
event_stations = load_output_table("event_station_records")

print(f"Prepared stations: {len(stations)}")
print(f"Prepared events: {len(events)}")
print(f"Event-station records: {len(event_stations)}")
Prepared stations: 30
Prepared events: 5
Event-station records: 150
Run time: 113.0 ms
Use the QC helpers to inspect the observed and synthetic traces, then apply those decisions to the metric-level QC table. Observed and synthetic records are checked separately. A record is available for comparison only when both sides pass.
[4]:
# Resolve metrics, components, passbands, and spectral settings from the active config.
metric_settings = metrics_settings_from_config()

# Check the processed observed and synthetic waveform files against the configured QC rules.
trace_qc_summary = build_waveform_qc_summary(
    event_stations,
    components=metric_settings.components,
    passbands=metric_settings.passbands,
    verbose=True,
    checkpoint_path=resolve_output_path("qc_trace_summary", kind="table", create_parent=True),
)

# Save the waveform-level QC table so you can inspect trace-level decisions directly.
write_output_table("qc_trace_summary", trace_qc_summary)

# Build side-specific metric QC rows and apply the waveform-level QC decisions.
qc_summary = build_metric_qc_summary(
    event_stations,
    metrics=metric_settings.metrics,
    components=metric_settings.components,
    passbands=metric_settings.passbands,
    spectral_periods_s=metric_settings.spectral.periods_s,
    synthetic_max_frequency_hz=metric_settings.synthetic_max_frequency_hz,
    trace_qc_summary=trace_qc_summary,
    verbose=True,
    checkpoint_path=resolve_output_path("qc_inventory", kind="table", create_parent=True),
)

# Save the QC inventory so later notebooks can filter metric calculations.
write_output_table("qc_inventory", qc_summary)
qc_summary.head()
[4]:
| source | event_id | station | event_title | event_lat | event_lon | station_lat | station_lon | network | magnitude | distance_km | component | passband | metric_group | metric | period_s | qc_status | qc_reason | |
|---|---|---|---|---|---|---|---|---|---|---|---|---|---|---|---|---|---|---|
| 0 | observed | ci38038071 | BFS | ci38038071 | 34.136333 | -117.774667 | 34.239 | -117.659 | CI | 4.38 | 15.60501 | Z | 1-2 sec | amplitude | PGA | NaN | pass | |
| 1 | observed | ci38038071 | BFS | ci38038071 | 34.136333 | -117.774667 | 34.239 | -117.659 | CI | 4.38 | 15.60501 | Z | 2-3 sec | amplitude | PGA | NaN | pass | |
| 2 | observed | ci38038071 | BFS | ci38038071 | 34.136333 | -117.774667 | 34.239 | -117.659 | CI | 4.38 | 15.60501 | Z | 1-2 sec | amplitude | PGV | NaN | pass | |
| 3 | observed | ci38038071 | BFS | ci38038071 | 34.136333 | -117.774667 | 34.239 | -117.659 | CI | 4.38 | 15.60501 | Z | 2-3 sec | amplitude | PGV | NaN | pass | |
| 4 | observed | ci38038071 | BFS | ci38038071 | 34.136333 | -117.774667 | 34.239 | -117.659 | CI | 4.38 | 15.60501 | Z | 1-2 sec | amplitude | PGD | NaN | pass |
Run time: 13.25 s
Find Comparison-Eligible Records
A row is comparison-ready when the observed side and synthetic side both pass for the same event, station, component, passband, metric, and period.
[5]:
# Keep only event-station-component-passband rows where observed and synthetic data both pass QC.
comparison_eligible = build_comparison_eligibility(qc_summary)

# Save the comparison-eligible records for the metric workflow.
write_output_table("comparison_eligible_records", comparison_eligible)
comparison_eligible.head()
[5]:
| source_observed | event_id | station | component | passband | metric_group | metric | period_s | qc_status_observed | qc_reason_observed | ... | qc_status_synthetic | qc_reason_synthetic | event_title | event_lat | event_lon | station_lat | station_lon | network | magnitude | distance_km | |
|---|---|---|---|---|---|---|---|---|---|---|---|---|---|---|---|---|---|---|---|---|---|
| 0 | observed | ci38038071 | BFS | Z | 1-2 sec | amplitude | PGA | NaN | pass | ... | pass | ci38038071 | 34.136333 | -117.774667 | 34.239 | -117.659 | CI | 4.38 | 15.60501 | ||
| 1 | observed | ci38038071 | BFS | Z | 2-3 sec | amplitude | PGA | NaN | pass | ... | pass | ci38038071 | 34.136333 | -117.774667 | 34.239 | -117.659 | CI | 4.38 | 15.60501 | ||
| 2 | observed | ci38038071 | BFS | Z | 1-2 sec | amplitude | PGV | NaN | pass | ... | pass | ci38038071 | 34.136333 | -117.774667 | 34.239 | -117.659 | CI | 4.38 | 15.60501 | ||
| 3 | observed | ci38038071 | BFS | Z | 2-3 sec | amplitude | PGV | NaN | pass | ... | pass | ci38038071 | 34.136333 | -117.774667 | 34.239 | -117.659 | CI | 4.38 | 15.60501 | ||
| 4 | observed | ci38038071 | BFS | Z | 1-2 sec | amplitude | PGD | NaN | pass | ... | pass | ci38038071 | 34.136333 | -117.774667 | 34.239 | -117.659 | CI | 4.38 | 15.60501 |
5 rows × 21 columns
Run time: 225.8 ms
Make QC Figures
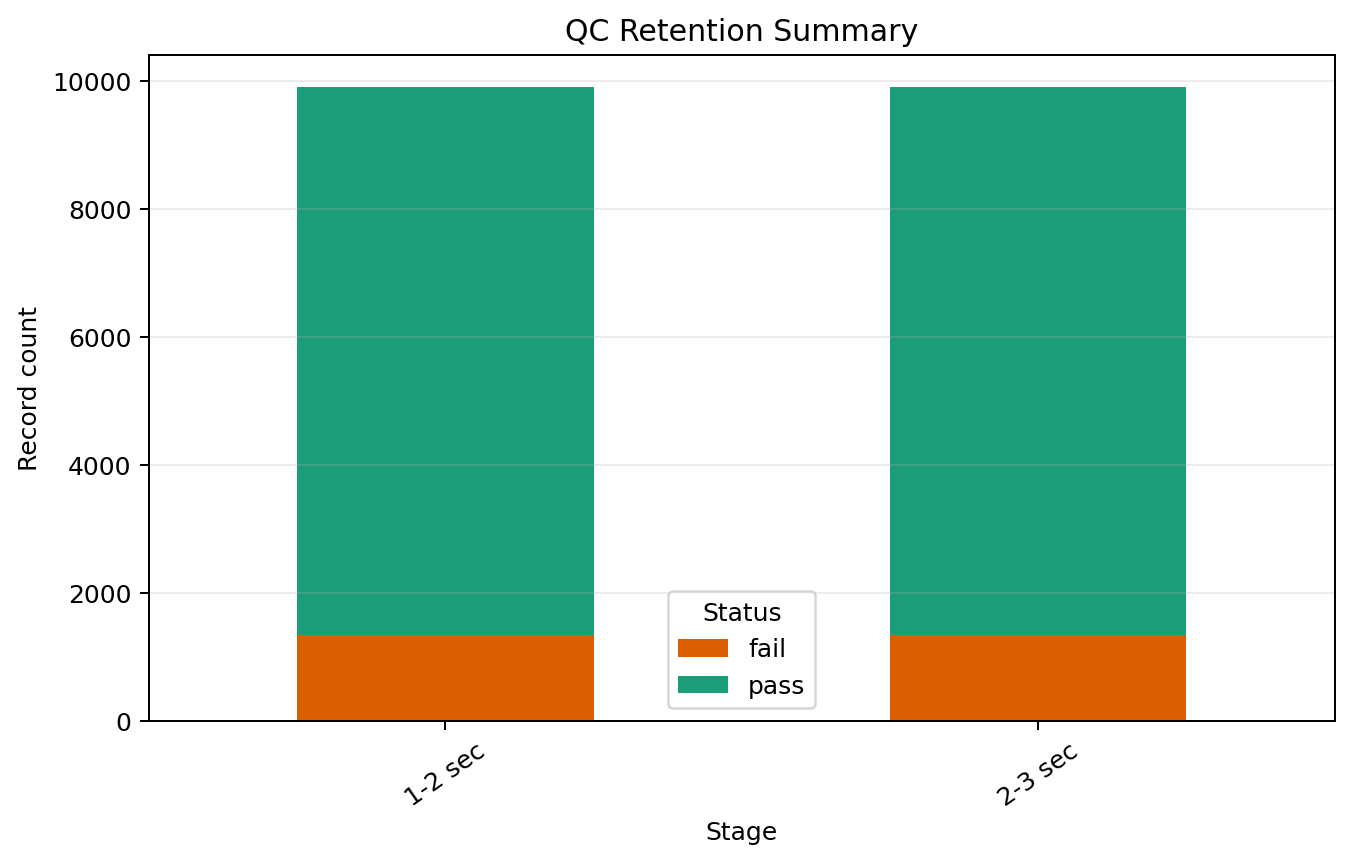
These figures summarize QC pass/fail counts, retained comparison pairs by event and station, station-event coverage after QC, and reasons records were dropped.
[6]:
# Summarize pass/fail counts by period band.
retention_table = build_retention_figure_table(qc_summary)
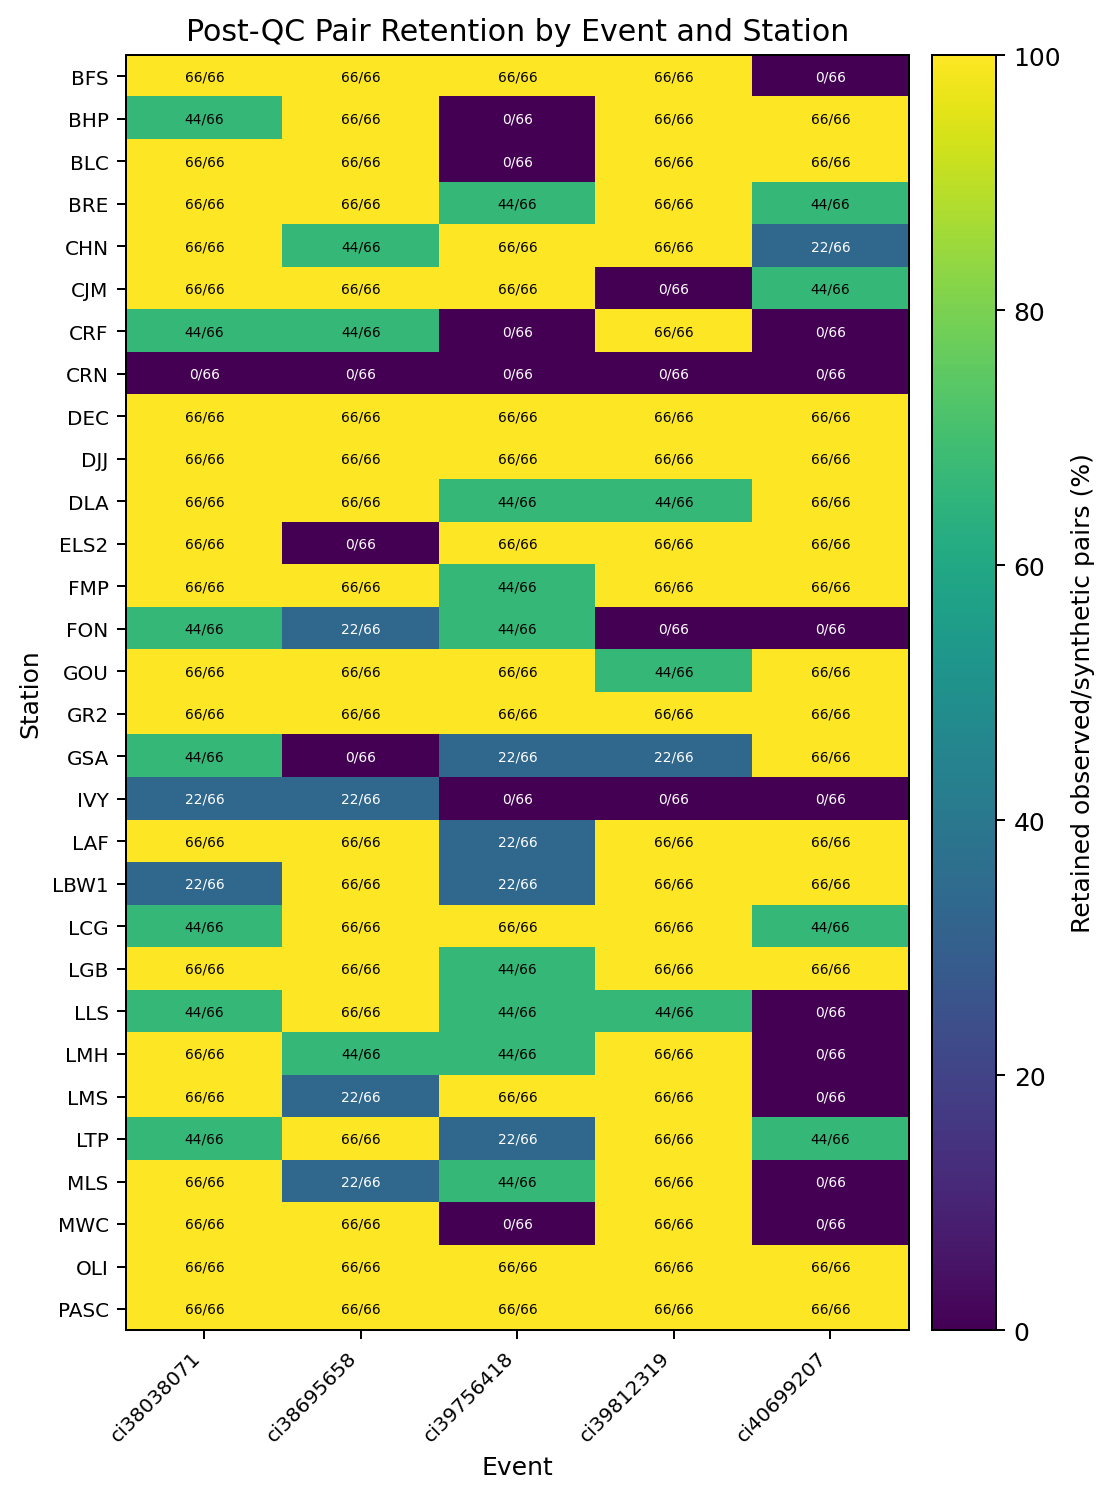
# Summarize retained observed/synthetic comparison pairs for each station-event pair.
event_station_retention = build_event_station_pair_retention_table(qc_summary)
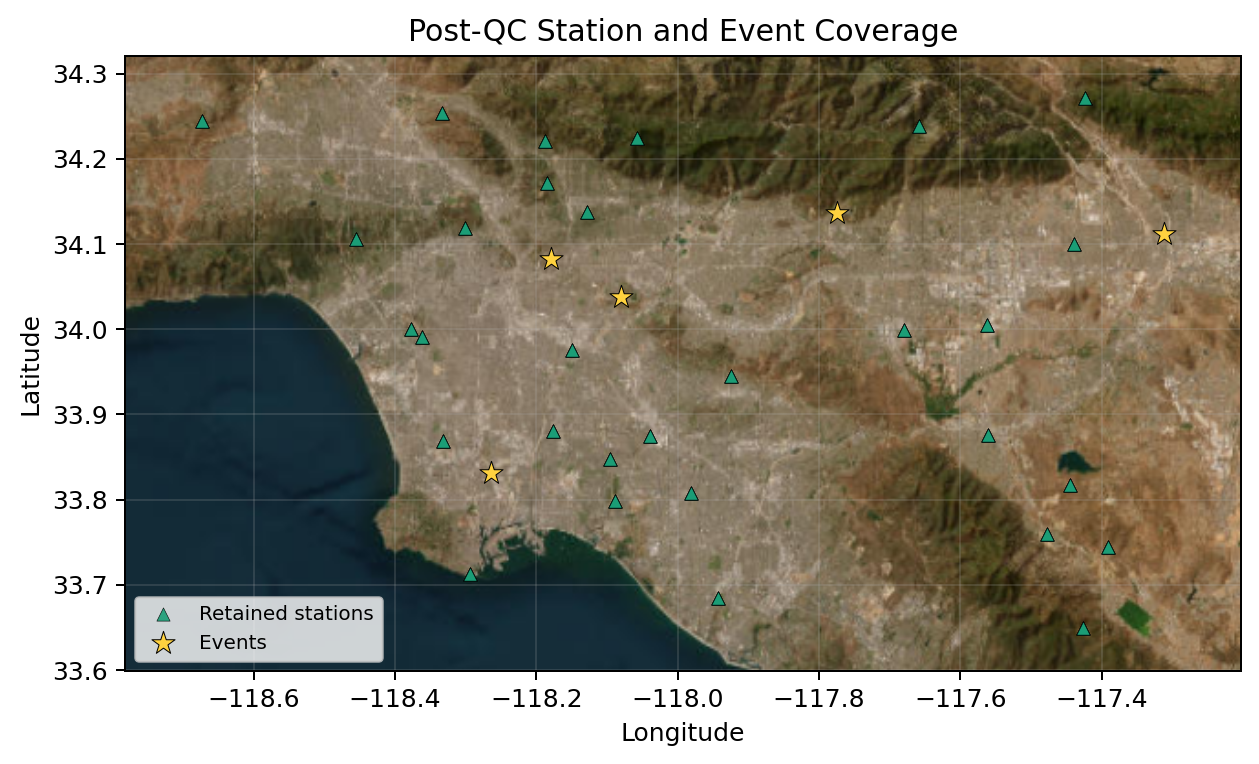
# Join post-QC decisions back to event and station coordinates for mapping.
post_qc_records = build_post_qc_record_table(event_stations, events=events, qc_summary=qc_summary)
# QC retention summary: pass/fail counts by period band.
retention_fig = plot_retention_summary(
retention_table,
title="QC Retention Summary",
showfig=True,
savefig=True,
)
# Event-station heatmap: percentage of comparison pairs retained across components, passbands, and metrics.
availability_fig = plot_event_station_retention_heatmap(
event_station_retention,
title="Post-QC Pair Retention by Event and Station",
showfig=True,
savefig=True,
)
# Post-QC map: where accepted and rejected event-station records are located.
post_qc_fig = plot_post_qc_station_event_map(post_qc_records, add_basemap=True, showfig=True, savefig=True)
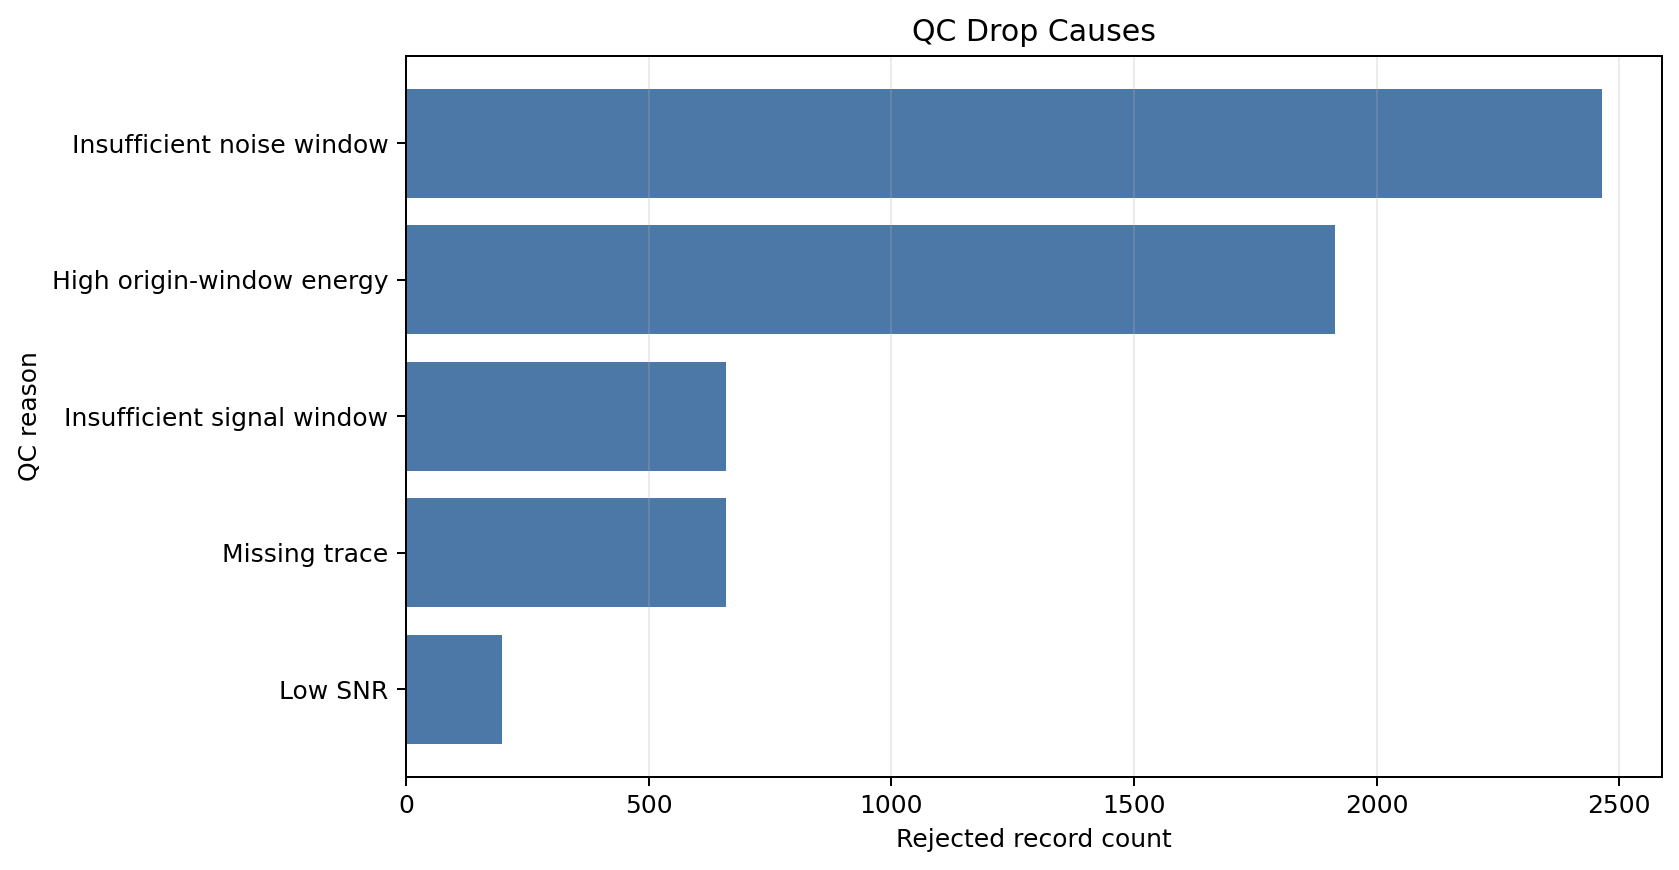
# Drop-cause diagnostics: the main reasons records were removed.
drop_cause_fig = plot_qc_drop_cause_diagnostics(qc_summary, showfig=True, savefig=True)
Run time: 4.19 s
Inspect QC-Passed Waveforms
Before opening the dashboard, plot a small set of retained R-component observed/synthetic waveform pairs. These are the processed waveforms that passed QC, limited to nearby stations so you can quickly check whether the traces look comparable.
[7]:
# Load QC-passed R-component observed/synthetic waveform pairs within 50 km.
waveform_preview = build_qc_waveform_comparison_records(
    event_stations,
    comparison_eligible=comparison_eligible,
    component="R",
    max_distance_km=50,
    max_records=12,
)

# Plot unnormalized waveforms with boosted automatic display gain so relative observed/synthetic amplitudes are preserved.
waveform_comparison_fig = plot_event_trace_comparison(
    waveform_preview,
    normalize=False,
    amplitude_gain="auto",
    amplitude_gain_multiplier=2.5,
    distance_limit_km=None,
    time_limit_s=60,
    title="Post-QC R-Component Observed and Synthetic Waveforms",
    filter_label=f"{waveform_preprocessing_label()}; unnormalized traces; display gain auto x2.5",
    showfig=True,
    savefig=True,
)
print(f"Waveform pairs shown: {len(waveform_preview)}")
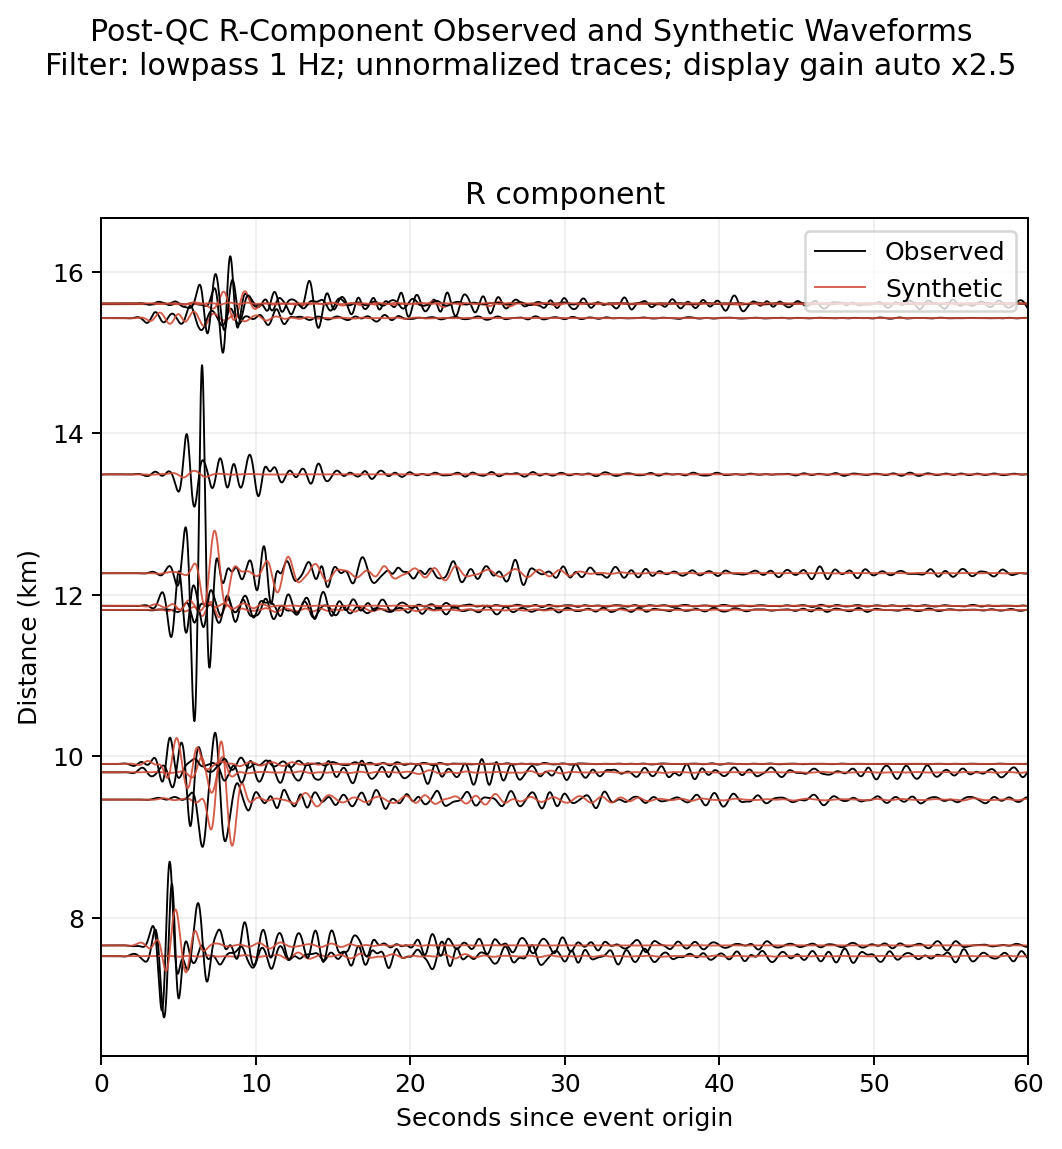
Waveform pairs shown: 12
Run time: 1.19 s
Open the QC Dashboard
The QC dashboard opens with the table you just wrote. The Manual Review Queue tab lets you inspect the queue and download the picker-ready CSV.
[8]:
# Export a manual-review queue that the manual QC picker can read.
manual_queue_path = export_manual_review_queue(qc_summary)

# Launch the QC dashboard when you run the notebook interactively.
qc_process = launch_qc_dashboard(
    server_port=notebook_overrides["qc_dashboard_port"],
    show=True,
)
print(f"QC dashboard: http://127.0.0.1:{notebook_overrides['qc_dashboard_port']}")
print(f"Manual-review queue: {manual_queue_path.relative_to(repo_root)}")
QC dashboard: http://127.0.0.1:8502
Manual-review queue: outputs/tutorials/tables/manual_review_queue.csv
Run time: 151.4 ms