Data Formats
This page shows what you need before you start using Spatial-VTK and what you can expect the toolkit to write as you move through a workflow.
Spatial-VTK does not download observed data and it does not run simulations. You bring the observed waveforms, synthetic waveforms, and metadata; Spatial-VTK helps you prepare them, check them, calculate metrics, analyze spatial patterns, and make figures or dashboards. If you still need observed waveforms, start with the ObsPy FDSN client documentation or the ObsPy mass downloader. If you still need synthetic waveforms, look at simulation tools such as SPECFEM3D Cartesian or Salvus.
What You Need First
For the basic workflow, you should have these files available on disk:
- Observed waveforms
These are your recorded data. Spatial-VTK can read waveform files through ObsPy, so MiniSEED and SAC are good starting points. The lightweight reader also supports simple
.npyand.npzarrays for small examples and tests.- Synthetic waveforms
These are your simulated waveforms for the same events, stations, and components you want to compare. Normalized MiniSEED is the easiest format to use. ASDF is also supported when
pyasdfis installed. Some Salvus-style outputs can be inspected and normalized, but generic HDF5 files need a schema-specific adapter before Spatial-VTK can calculate metrics from them.- Station metadata
At minimum, you need station code and station coordinates. Network code is optional but strongly recommended because it helps avoid station-name collisions.
- Event metadata
At minimum, you need event ID and event coordinates. Origin time, magnitude, depth, mechanism, and source labels are optional but useful for filtering, plotting, and spatial summaries.
The observed and synthetic files do not need to have identical directory layouts, but they do need enough metadata to match the same event, station, and component. The first tutorial notebook will walk you through creating the prepared station, event, event-station, and waveform inventory tables that later steps read from disk.
Example Metadata
Spatial-VTK is intentionally forgiving about common station and event column
names. For example, station latitude can be named lat, latitude,
station_lat, station_latitude, or similar common variants. During
preparation, Spatial-VTK writes consistent columns such as station,
network, lat, lon, event_id, event_lat, and event_lon.
Here is a tiny station table, adapted from the LA Basin example metadata:
station,network,station_lat,station_lon,event_count
BFS,CI,34.239,-117.659,4
BHP,CI,33.991,-118.362,5
BLC,CI,34.244,-118.673,4
BRE,CI,33.808,-117.981,5
CAC,CI,34.137,-118.122,4
Here is the matching style for event metadata:
event_id,event_title,event_place,start,event_lat,event_lon,depth_km,magnitude,observed_file,synthetic_file
ci38038071,ci38038071,"4km N of La Verne, CA",2018-08-29T02:33:28.330000+00:00,34.1363333,-117.7746667,5.46,4.38,observed/ci38038071.mseed,synthetics/cvmsi/ci38038071.mseed
ci38695658,ci38695658,"3km WSW of South El Monte, CA",2020-09-19T06:38:46.930000+00:00,34.038,-118.08,16.87,4.54,observed/ci38695658.mseed,synthetics/cvmsi/ci38695658.mseed
ci39812319,ci39812319,"2km E of Carson, CA",2021-09-18T02:58:34.700000+00:00,33.8313333,-118.2636667,11.86,4.28,observed/ci39812319.mseed,synthetics/cvmsi/ci39812319.mseed
The source checkout includes lightweight LA Basin example metadata under
data/examples/example_five_event_subset/metadata/ plus a dataset manifest
that describes the companion five-event waveform bundle used by the tutorial
notebooks. Keep the manifest in git; download or generate the larger observed
waveform products and synthetic MiniSEED files separately before running the
full tutorial workflow end to end.
Optional Inputs
You can run a basic metric workflow with waveforms plus event and station metadata. The optional inputs below unlock more useful QC, mapping, and spatial analysis.
- Waveform inventory tables
These tables point to waveform files and usually include
source,event_id,station,component,model,waveform_path, sampling information, and optional synthetic maximum frequency. Spatial-VTK can build lightweight inventories from folders, and you can also provide your own.
Download example_waveform_inventory.csv
source,event_id,station,component,model,waveform_path,dt,sampling_rate,starttime,endtime,synthetic_max_frequency_hz
observed,ci38038071,BFS,Z,,observed/ci38038071_proc.pkl,0.01,100,2018-08-29T02:33:20Z,2018-08-29T02:35:20Z,
synthetic,ci38038071,BFS,Z,cvmsi,synthetics/cvmsi/ci38038071.mseed,0.01,100,2018-08-29T02:33:20Z,2018-08-29T02:35:20Z,1.0
observed,ci38695658,BHP,R,,observed/ci38695658_proc.pkl,0.01,100,2020-09-19T06:38:39Z,2020-09-19T06:40:39Z,
synthetic,ci38695658,BHP,R,cvmsi,synthetics/cvmsi/ci38695658.mseed,0.01,100,2020-09-19T06:38:39Z,2020-09-19T06:40:39Z,1.0
- QC tables
QC tables let the metric workflow skip traces or spectral periods that did not pass your quality rules. They usually include source, event, station, component, passband or period, metric group, QC status, and a short reason. Waveform QC can also publish a side-specific valid metric interval through
valid_start_rel_sandvalid_end_rel_splus optional inclusive and exclusive sample bounds,valid_start_sampleandvalid_end_sample. Metric workflows use those windows to exclude filter-edge and other transient-invalid samples before calculating metrics. The waveform-QC signal window follows the same valid-interval contract; its SNR noise window may extend outside the valid interval so noisy pre-signal data can lower SNR instead of becoming aninsufficient_noise_windowfailure. When an arrival-pick catalog is supplied, waveform QC uses a picker onset only if its signal window has enough finite samples in the valid interval; otherwise it falls back to the waveform-envelope onset.
Download example_qc_summary.csv
source,event_id,station,component,passband,metric_group,metric,period_s,qc_status,qc_reason
observed,ci38038071,BFS,Z,1-2 sec,amplitude,PGA,,pass,
synthetic,ci38038071,BFS,Z,1-2 sec,amplitude,PGA,,pass,
observed,ci38695658,BHP,R,2-3 sec,spectral,PSA,2.0,pass,
synthetic,ci38695658,BHP,R,2-3 sec,spectral,PSA,2.0,pass,
- Station or event subsets
Simple CSV lists are useful when you want to run a notebook or command on a smaller set of events or stations before scaling up.
Download example_station_subset.csv
station
BFS
BHP
BLC
BRE
Download example_event_subset.csv
event_id
ci38038071
ci38695658
ci39812319
- Site, geology, and geomorphology metadata
These can be CSV or Parquet tables joined by station, event, or polygon labels. Typical columns might include Vs30, geologic unit, geomorphology class, basin zone, elevation, mapped region codes, mapped region long names, or other features you want to compare against residual patterns.
Download example_site_metadata.csv
station,station_lon,station_lat,lab_zone,lab_edge_distance_km,mapped_region,mapped_region_long_name,mapped_region_type,geomorphology_class
BFS,-117.65853,34.23883,outside_LAB,40.7155652453678,SGM:Mountains,San Gabriel Mountains,Mountains,Mountain/hill
50501,-117.561058,33.87574,outside_LAB,22.224194072379,CB:Basin,Chino Basin,Basin,Other basin
BLC,-118.67312,34.24356,outside_LAB,27.29899457016873,SMM:Mountains,Santa Monica Mountains,Mountains,Mountain/hill
BRE,-117.98116,33.80776,LAB_edge_inside,7.454245421943712,LAB:Basin,Los Angeles Basin,Basin,LA Basin edge inside
- GeoJSON files
GeoJSON polygons are used for region membership, geologic classes, path crossings, corridor analysis, and region-based summaries. Feature properties should include clear labels such as
region_name,region_group,geology_class, or any other class name you want to use later. You can create custom GeoJSON files with tools such as geojson.io, including by drawing polygons or converting other geospatial files.
Here is a compact GeoJSON example with two polygon features:
Download example_path_regions.geojson
{
  "type": "FeatureCollection",
  "features": [
    {
      "type": "Feature",
      "properties": {
        "region_group": "example_regions",
        "region_name": "LA Basin",
        "short_name": "LAB",
        "long_name": "Los Angeles Basin",
        "mapped_region_type": "Basin",
        "region_type": "Basin"
      },
      "geometry": {
        "type": "Polygon",
        "coordinates": [
          [
            [
              -117.80537968155497,
              33.49887504448042
            ],
            [
              -117.96125228680644,
              33.623252792054636
            ],
            [
              -117.99755258655856,
              33.639847214798465
            ],
            [
              -118.00636837364122,
              33.65021872901335
            ],
            [
              -118.02918570491398,
              33.664738848914205
            ],
            [
              -118.04889158192228,
Expected Outputs
Spatial-VTK writes ordinary files so you can inspect them, reuse them in later notebooks, or open them in other tools. Most tabular outputs can be written as CSV or Parquet. Parquet is usually better for large metric tables and dashboard datasets; CSV is easier to preview and share in small examples.
- Prepared inputs
The first workflow steps write cleaned station tables, event tables, event-station tables, and waveform inventories. These are the handoff files that keep notebooks independent from hidden in-memory state.
Download example_prepared_stations.csv
station,network,lat,lon,event_count
BFS,CI,34.239,-117.659,4
BHP,CI,33.991,-118.362,5
BLC,CI,34.244,-118.673,4
BRE,CI,33.808,-117.981,5
- QC outputs
QC steps write trace inventories, QC summaries, rejected/accepted counts, sample lists for review, and manual-review queues. Manual-review queues are small CSV or JSON files that can be read by the manual QC picker.
Download example_manual_review_queue.csv
event_id,station,event_title,event_lat,event_lon,station_lat,station_lon,network,distance_km,source_context_count,source_contexts
ci38038071,BHP,ci38038071,34.1363333,-117.7746667,33.991,-118.362,CI,56.5,2,"observed,synthetic"
ci38695658,BLC,ci38695658,34.038,-118.08,34.244,-118.673,CI,58.9,2,"observed,synthetic"
- Metric tables
The central output is a long metric table. A typical row represents one event, station, component, model, passband, metric, and sometimes one spectral period. The row can include observed metric values, synthetic metric values, observed-minus-synthetic residuals, log residuals, GOF scores, side-specific QC status, event metadata, station metadata, and path geometry such as distance and azimuth.
Download example_metrics_snapshot.csv
event_id,station,network,component,model,band,metric,metric_group,period_s,value_obs,value_syn,residual,log2_residual,anderson_2004_gof,olsen_mayhew_2011_gof,event_magnitude,depth_km,event_lat,event_lon,sta_lat,sta_lon,distance_km,azimuth_deg,region_name
ci38038071,BFS,CI,Z,cvmsi,1-2 sec,PGA,amplitude,,0.118,0.104,0.014,0.184,8.7,8.4,4.38,5.46,34.1363333,-117.7746667,34.239,-117.659,15.6,42.3,central_basin
ci38038071,BHP,CI,Z,cvmsi,1-2 sec,PGV,amplitude,,5.41,6.22,-0.81,-0.201,7.9,7.5,4.38,5.46,34.1363333,-117.7746667,33.991,-118.362,56.5,253.7,west_basin
ci38695658,BLC,CI,R,cvmsi,2-3 sec,PSA,spectral,2.0,0.284,0.211,0.073,0.429,8.2,8.0,4.54,16.87,34.038,-118.08,34.244,-118.673,58.9,292.1,west_basin
ci39812319,BRE,CI,T,cvmsi,3-5 sec,FAS,spectral,3.0,0.037,0.052,-0.015,-0.491,7.4,7.1,4.28,11.86,33.8313333,-118.2636667,33.808,-117.981,26.2,94.5,central_basin
- Spatial outputs
Spatial-statistics steps write tables for station bias, event-centered residuals, distance-bin correlations, Moran tests, clusters, PCA spatial modes, geology or region summaries, path crossings, and corridor selections.
Download example_spatial_summary.csv
summary_type,group_name,metric,band,value_column,n_events,n_stations,median_value,mean_value,p_value
station_bias,BFS,PGA,1-2 sec,log2_residual,1,1,0.184,0.184,
region_summary,west_basin,PGV,1-2 sec,log2_residual,1,1,-0.201,-0.201,
moran_test,all_stations,PSA,2-3 sec,log2_residual,2,2,0.114,0.114,0.08
- Figures and maps
Plotting and mapping functions write standard image files, usually PNG for quick review and PDF when you need a vector-friendly figure. Map examples use
contextilyto fetch basemap tiles when you render the figure, so you need network access or a local tile cache for basemap-backed maps.
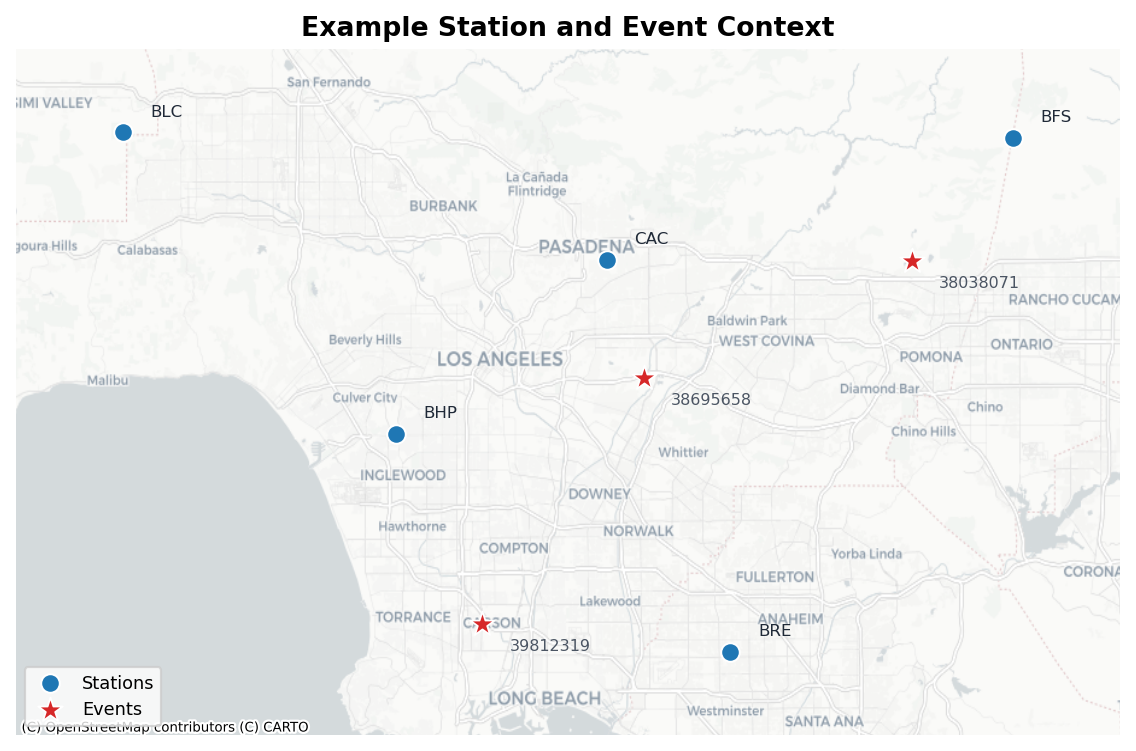
A simple station/event context figure helps you check that your coordinates and IDs look sensible before running expensive calculations.
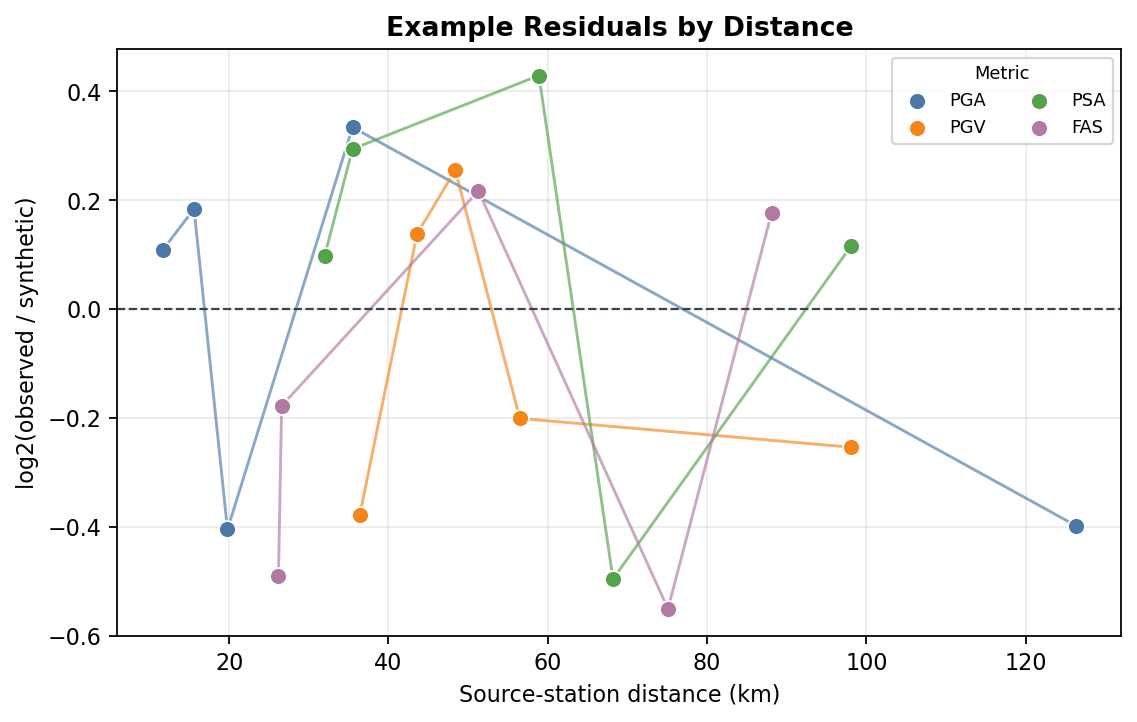
Metric and spatial plots summarize how observed/synthetic differences vary with distance, period band, station, event, model, or metadata class.
- Dashboard outputs
Dashboard preparation writes the datasets needed by the Streamlit dashboards. The dashboards themselves are interactive local pages: you can filter by model, band, metric, value column, event, station, and other metadata, then export the filtered rows for follow-up work.
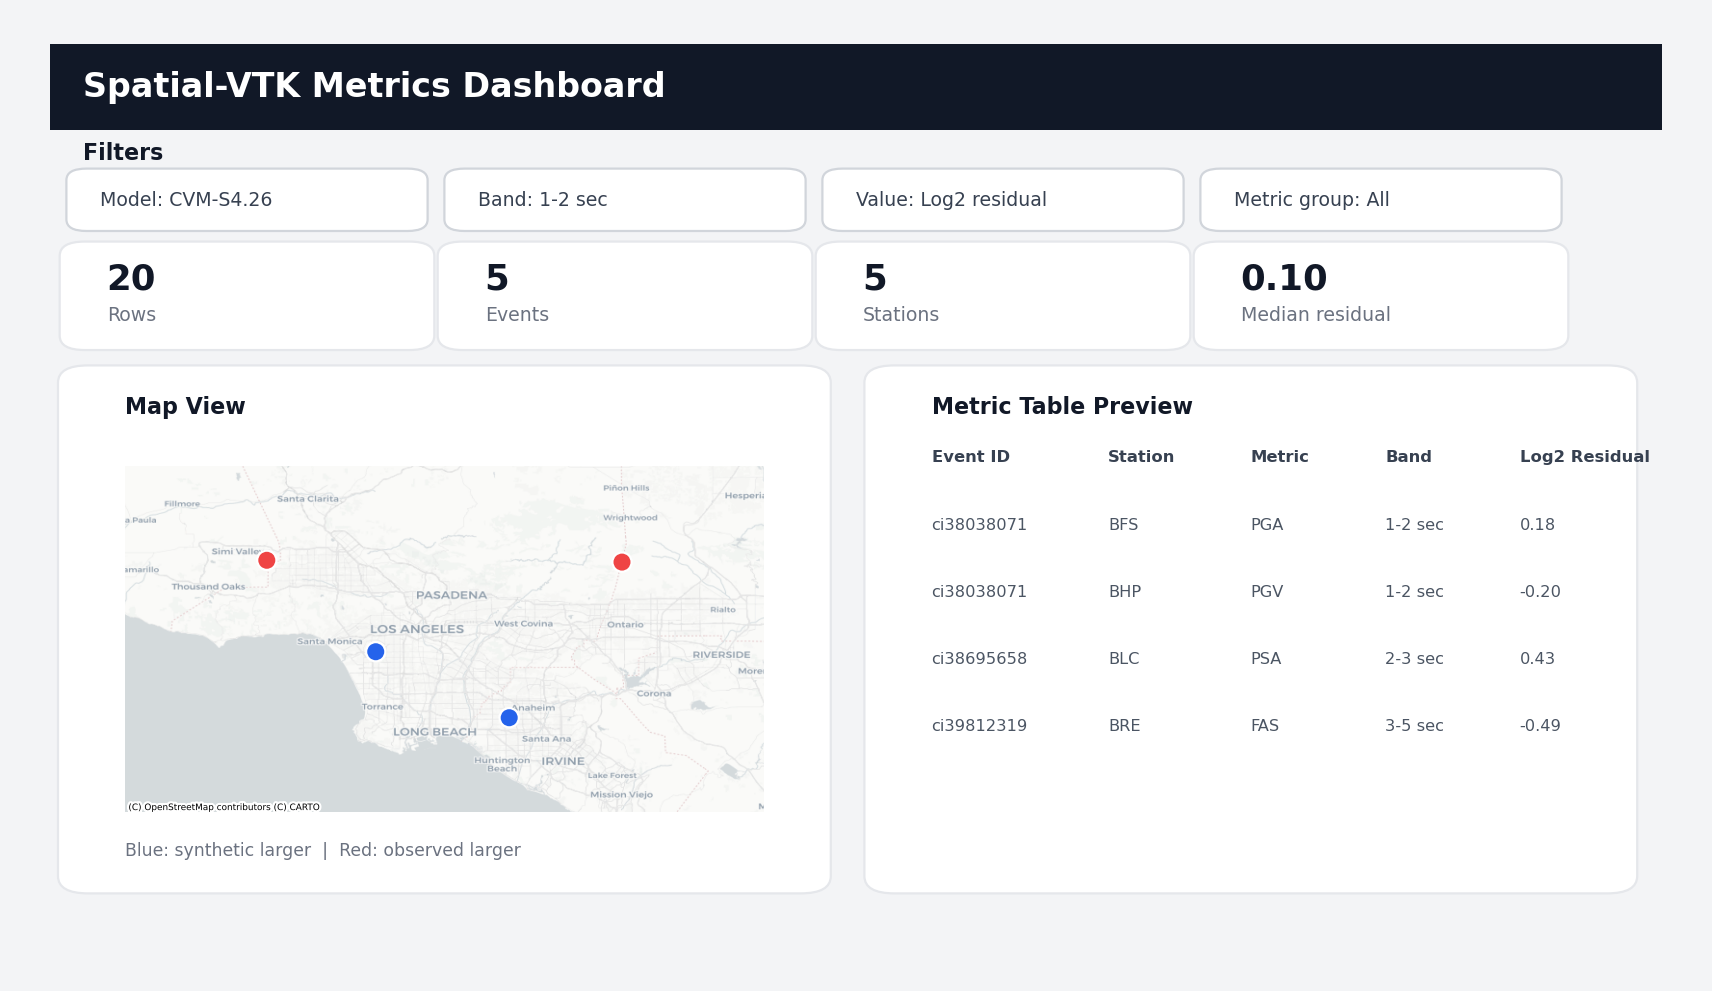
Dashboard datasets feed interactive Streamlit pages for exploring metric rows, maps, summaries, and filtered exports.
The next page, Configuration, will show how to point Spatial-VTK at these files without hard-coding paths throughout your notebooks.